Analysis view
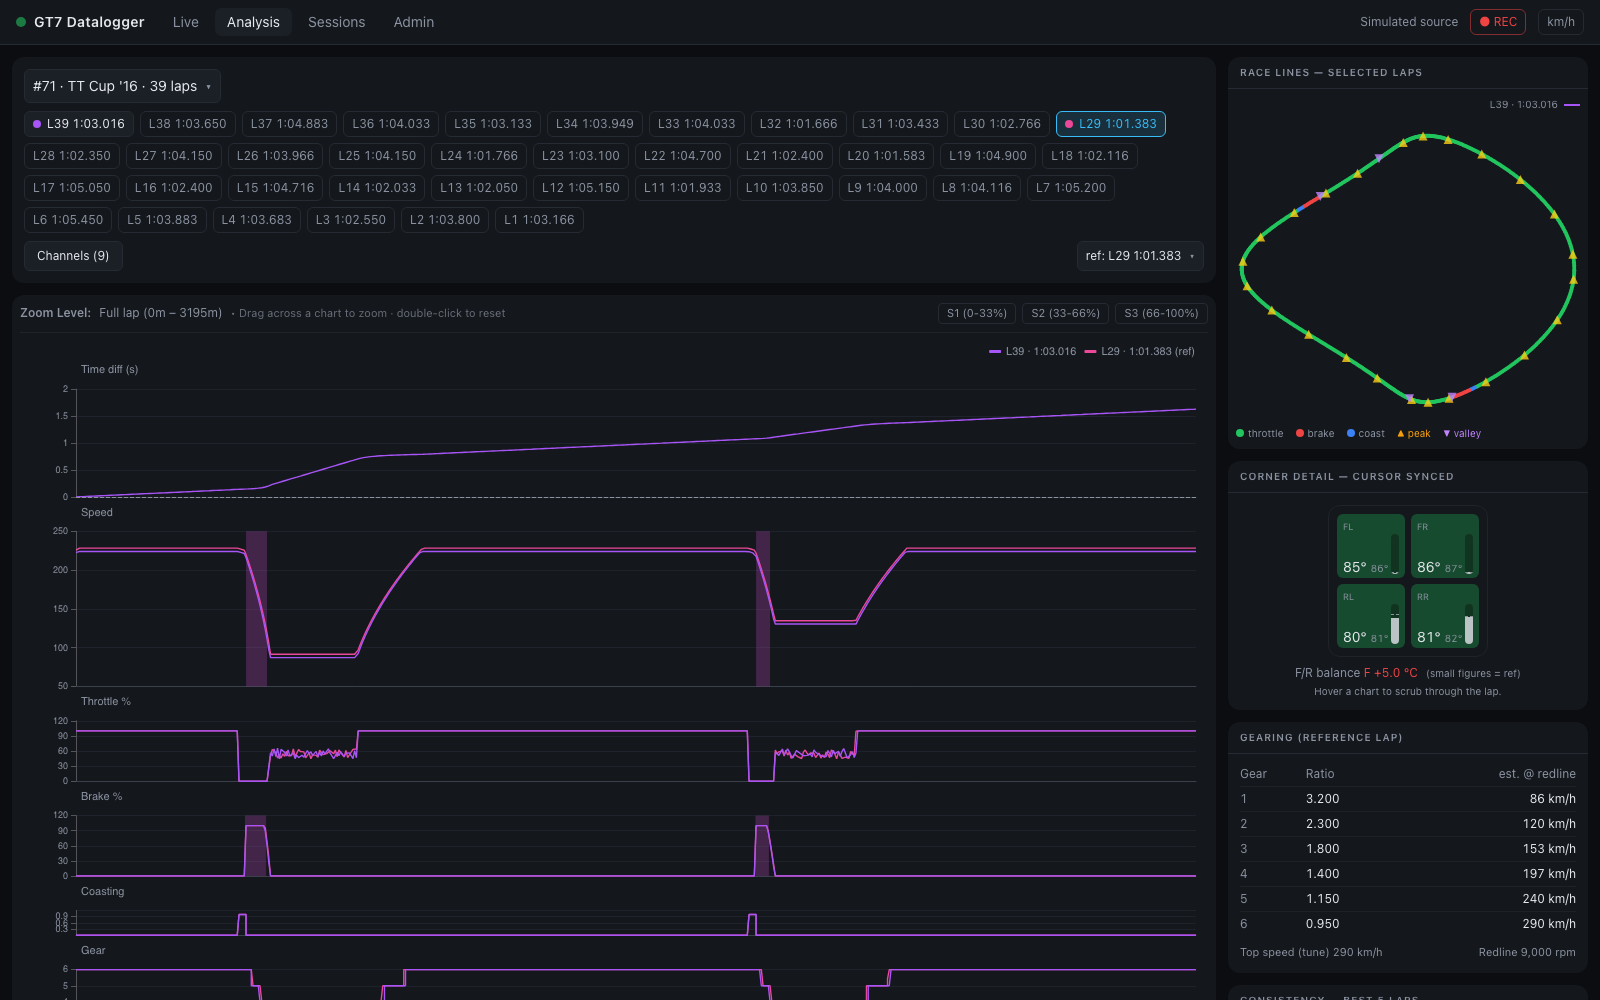
#/analysis — overlay any number of laps against a reference lap and find where the
time goes. The x-axis everywhere is distance into the lap, so laps of different
speeds line up corner-for-corner (see Lap comparison math).
Selecting laps
- Pick a session from the dropdown (
#id · car · n laps). The newest session with laps is selected by default. - Click lap chips to toggle them into the comparison.
- Double-click a chip (or use the
ref:dropdown) to make it the reference lap — the lap everything else is measured against. - + Add lap… brings in laps from other sessions at the same circuit: the
picker lists every lap ever recorded there, fastest first — the lap you are
hunting for is almost always the quick one — and a picked lap joins the comparison
as a guest chip labelled
S12·L3(session 12, lap 3). Guests behave exactly like local laps: time diff, corner report, map, reference — all of it.
Until you pick manually, the view auto-selects latest vs best — best meaning the quickest lap that counts, so a pit out-lap or an excluded lap is never the default reference — and keeps following as new laps arrive live — useful on a second screen while driving. Any manual change pins your selection.
A session with no completed lap yet — the one you have only just started driving — says so in place of the map, and fills in by itself the moment its first lap is finished. Changing session always starts from that session's own laps: nothing selected for the one you were looking at comes along.
Same circuit only
Every chart's x-axis is the reference lap's distance from the start line, and every other lap is placed on it by where it was on track — which works across sessions on the same circuit, and is why the picker only ever offers laps from this session's own circuit (it needs the session's track to be named). A lap that can't be followed along the reference's path keeps its own distance instead. Overlaying laps from different circuits would align nothing with nothing, so the UI doesn't offer it.
Deep links
The full selection is encoded in the URL —
#/analysis?session=3&laps=12,15&ref=15&ch=speed,brake&lens=tire_temp — so a
bookmark or shared link reproduces the selection. ch= and lens= are there only
when the channels or the map's lens differ from
the defaults; a link without them leaves the viewer's own channels and lens as
they are. The Sessions and Live views use these links for
their compare / analyze shortcuts. Lap ids are global, so a link may name
laps from other sessions (#/analysis?session=3&laps=12,208) — they load as
guest chips rather than being pruned.
Stacked charts
The first panel is always Time diff (s) — each lap's gap to the reference at each point of the track (positive = slower; where the curve climbs is where you lose time). Below it, one panel per selected channel. Every panel runs to the end of the lap, the line itself, not the last whole 5 m before it.
- Synced cursors — hover any panel and a crosshair appears at the same distance in every panel, on the race line map, and in the Corner Detail widget. The tooltip shows one column per lap, unit-formatted.
- Zoom — drag across any chart to zoom a section; every panel, the map, the
lap strip and the deviation chart crop to it. The strip's S1…Sn
buttons jump to the track's sectors,
[and]step through the corners, and Esc, a double-click or Full lap reset. A compact copy of the strip stays pinned over the charts as they scroll, so the zoom is always in reach with all 31 channels on. (Mouse-wheel zoom is off on the charts on purpose so page scrolling stays normal; on the map, ⌘/Ctrl + wheel zooms.) - Event shading — detected chassis events shade the panel that explains them: lockups on Brake, wheelspin on Throttle, bottoming/kerbs on suspension panels; TCS activity shades Throttle, ASM shades Speed. Bands are tinted in the lap's color.
- Gear choice — the Gear panel also draws the gear GT7 suggested, and shades the corners taken a gear higher; see below.
Gear choice
GT7 suggests a gear on its HUD (the → 3 beside the gear), and a lap now keeps the suggestion beside the gear it was in; laps recorded before that have none. On the Gear panel each lap that has suggestions gets a dashed line in its own colour: the gear GT7 suggested, broken wherever it suggested nothing. The tooltip lists it under the gear as Suggested.
The panel is shaded, in the lap's colour, through each corner the lap took a gear high (below): inside the corner's window (the reference lap's corners, as everywhere else), wherever the lap was in a higher gear than GT7 suggested between the entry and its slowest point in the corner. A corner the lap got down in time for is not shaded, although every braking lap sits above the suggestion for a while as it comes down through the box. Past the slowest point the car is accelerating and the next gear up is no mistake, so nothing there is shaded either.
The gear suggested for a corner is the last suggestion seen from the start of its approach — 250 m before its entry, never back past the previous corner's apex — to its slowest point. The last one rather than the one at the slowest point, because whether GT7 keeps the hint up until then or clears it once you are in the gear it asked for has not been checked against a console. A corner is taken a gear high when the gear at its slowest point is higher than that suggestion. A corner GT7 suggested nothing for, one across the start line, or a car in neutral or reverse at the slowest point is not judged at all. The Tuning panel counts the reference lap's corners taken a gear high, and the Sessions lap table every lap's (Gear high).
Note
When GT7 fills the suggestion — on which cars and in which modes, whether it ever suggests an upshift, whether a HUD setting turns it off — has not been checked against a console recording yet. A lap on which GT7 suggested nothing has no suggestion line and no shading, and is not judged.
Lap playback
Above the charts sits a transport — play / pause, a scrub bar, and 0.25× – 4× speed — that drives the same synced cursor the hover does. Press play and the lap happens: the dot runs around the race line, the traction-circle marker sweeps, and the Corner Detail widget follows, with no mouse involved.
The playhead is distance-locked (every compared lap sits at the same point of the track, so the time diff under the cursor stays directly readable) but it advances on the reference lap's own clock — it dwells through slow corners and sweeps down the straights, rather than gliding at constant metres per second. The race line shows the other laps by time meanwhile, so the gap opens up as distance on track.
Beside the transport, a strip of the live-dashboard widgets renders the reference lap at the playhead: the steering wheel turning (packet B+ recordings), the throttle/brake bars, current gear (with GT7's suggested gear beside it, where the lap recorded one) and speed — the driver's hands, replayed.
Details worth knowing:
- Scrubbing while playing repositions the clock and playback continues from there; chart hover is ignored while playing (the playhead owns the cursor) and works normally whenever playback is paused or stopped.
- Playback pauses itself when the tab is hidden, and under a system reduced motion preference the cursor steps a few times a second instead of animating every frame.
- Switching the reference lap (or the selection) rewinds to the start.
Corner report card
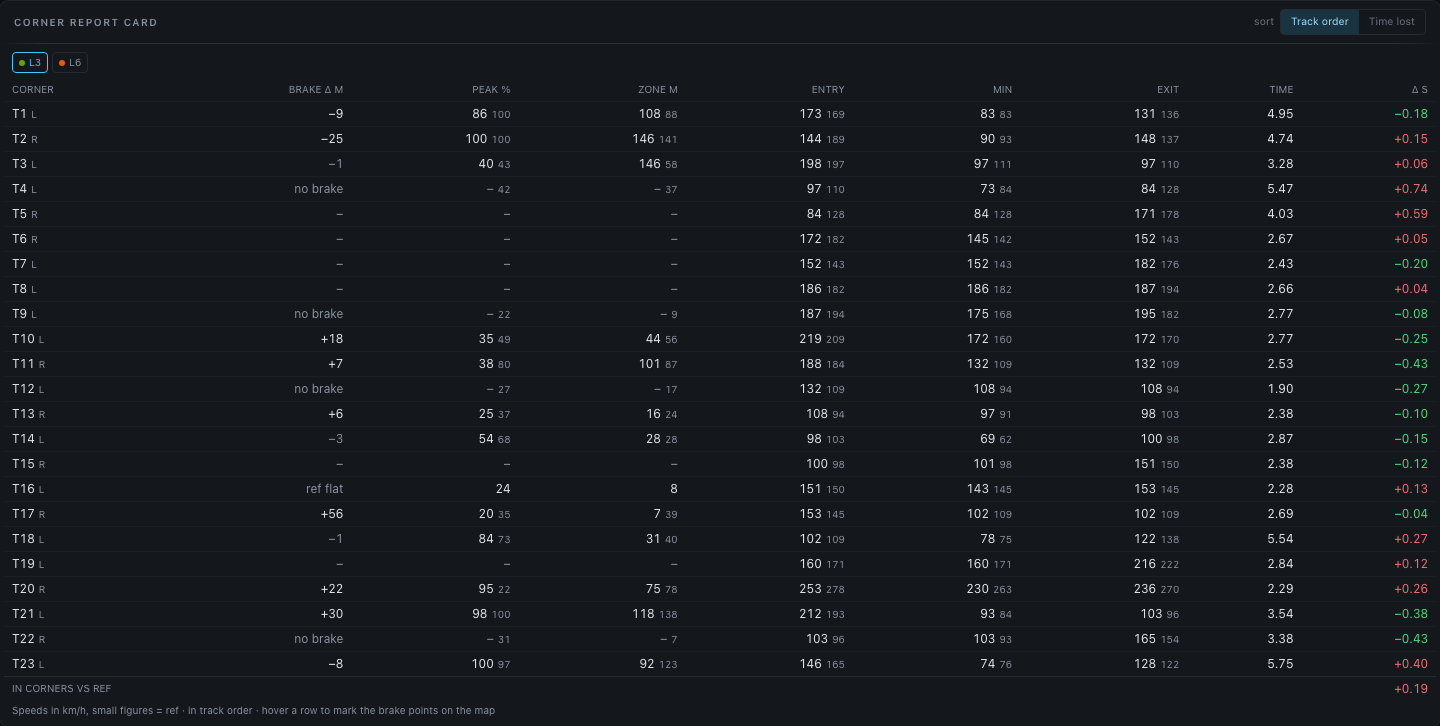
Below the charts, one row per corner: entry / minimum / exit speed and the time spent between the corner's entry and exit, for the focused lap with the reference's figures in small type beside it. The Δ s column is the time lost (red) or gained (green) through that corner vs the reference. Rows are in track order (T1, T2 …), which is how a lap is remembered; the sort switch in the header puts the biggest loss first instead, so the first row is where the lap is actually being lost. The footer sums it: your total gap that happened inside corners rather than on the straights.
Every lap is measured through the reference lap's corner windows (the same distance-from-start convention as the time-diff chart), so the times are comparable; with more than one comparison lap, chips pick which one the card focuses on. Clicking a row zooms every chart and the map to that corner. Corners come from the circuit's authored set when it has one — stable numbers and names across sessions — otherwise from detection on the reference lap.
Braking
Three columns say how the corner was braked for:
| Column | What it is |
|---|---|
| Brake Δ m | Where the brake went on against the reference lap, in metres along the track: −14 is 14 m earlier, +6 is 6 m later (deeper). Dimmed under 5 m, which is the same brake point |
| Peak % | The most brake pedal the braking zone saw |
| Zone m | Metres from the brake going on to its release |
A corner taken without braking has no figures, not zeros. Where one lap braked and the other did not, the first column says which: no brake (the reference braked here, this lap did not) or ref flat. The columns are left out altogether when neither lap braked anywhere, as on an oval taken flat.
The braking point is the race engineer's: one definition, in
processing/corner_metrics.py, so the card, the spoken coaching and the
lap analysis document cannot disagree about where
you braked. How a brake application is given to a corner is in
Lap comparison math.
Hovering a row marks the two brake points on the race-line map — see Brake points.
Balance
On a recording that carries the body slip channel, two more columns say how far the car was rotated through the corner: Slip pk °, the most the nose pointed into the corner past the direction the car was travelling in, and Slip avg °, the same angle averaged from entry to exit. Both are positive with the nose into the corner, whichever way the corner turns, so more than the reference's small figure is more rotation — towards oversteer — and less, or a negative figure, is the nose pushing wide. Recordings made before 0.7.0 have no such channel, and the columns are left out.
On a recording made on packet C, which carries the front wheels' angle and the car's wheelbase, two more say how the car turned against what its front wheels asked for:
| Column | What it is |
|---|---|
| Yaw ÷ wheels | How much the car rotated through the corner over how much the front wheels asked for (speed × wheel angle ÷ wheelbase, the kinematic yaw). Under 1 is understeer, over 1 oversteer. Compare it lap against lap: after a setup change, the corner that moved is the one the change reached |
| Lock m | Metres of the corner the steering spent past full lock — the input kept rising and the front wheels could not turn further. Shown only once some corner of either lap ran out of lock |
These need no learned baseline for the car, so they are there from the first lap.
Stint trend
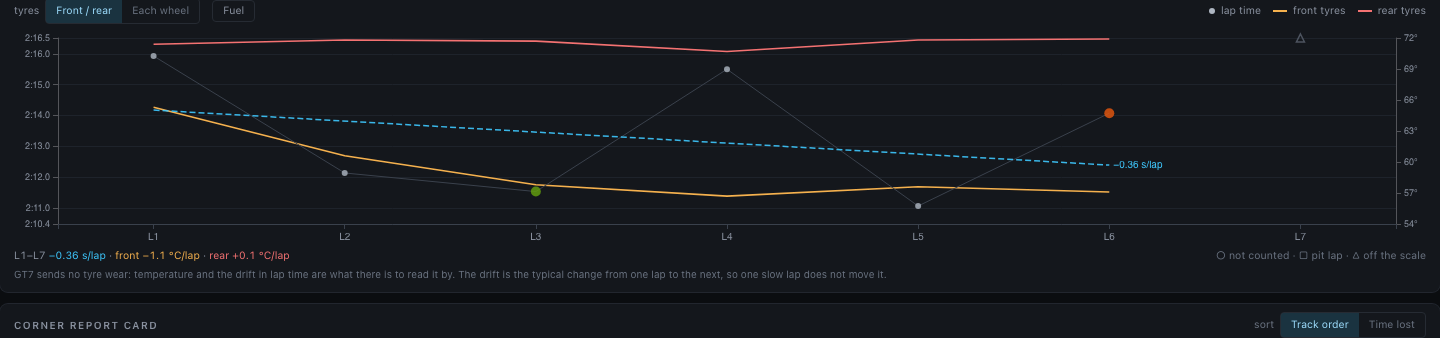
Every lap of the session on one chart: lap time as points against the left axis, the tyre temperatures as lines against the right one, lap number across. It is there to show tyres going away and the pace going with them, which no other panel puts side by side.
GT7 broadcasts no tyre wear. How hot the tyres ran and how the lap time drifted are the only two things there are to read it by, and the panel says so under the chart.
- Tyres switches the lines between Front / rear (each axle's average) and Each wheel. The temperature is the lap's average; hover a lap for each wheel's average and maximum.
- Fuel adds the fuel on board at the start of each lap as a dotted line. A lighter car is a quicker one, which hides part of what the tyres cost. The button is absent in a session that burned no fuel.
- The session is split into stints at pit stops, marked by a dashed line labelled pit. A lap the car was in the pits on is a hollow □ and belongs to neither stint, so an out-lap does not read as degradation and the step from worn tyres to new ones is not drawn as a slope.
- Laps that do not count toward bests — partial, or excluded by hand — are hollow ○: gaps in the trend, not points on it. A lap too slow for the scale is pinned to the top edge as a hollow △, so one spin cannot flatten the rest.
- Each stint has a dashed line fitted through its counting laps and the drift as a
figure:
+0.18 s/lap, with the front and rear tyres' own drift in °C a lap beside it. It needs three counting laps in the stint. The drift is the typical change from one lap to the next (a median of slopes), so one slow lap does not move it. - Click a lap to add it to the comparison, or take it out.
The trend is worked out from the stored laps, so it is there for every session, whenever it was recorded.
The guide
? in the toolbar opens a short guide to the view: a Features tab with a sentence or two on each part of the page, and a Channels tab explaining every chart channel — what it shows, how to read it, and what a recording needs to have it (a wider packet format, a race). Channels already on the chart are marked charted. A search box filters both, so understeer or lockup finds the channels that show them, and every entry links to its section of this documentation. It never opens by itself.
Channel picker
The Channels (n) button opens a grouped picker with 35 channels. Hovering one shows what it is, and What are these? opens the guide's channel list:
| Group | Channels |
|---|---|
| Driving | Speed, Throttle, Brake, Coasting, Gear, Yaw rate, Steering, Front wheel angle, Throttle/Brake applied, TCS cut, ABS release |
| Race | Race position — recorded only while GT7 reports positions, so the panel is simply empty on time trials |
| Engine | RPM, Boost, Engine torque |
| Tires & wheels | Tire spd/car spd, slip front/rear avg, slip per wheel, tire temp front/rear avg, tire temp F−R balance |
| Chassis | Ride height, susp travel front/rear avg, lateral / longitudinal / vertical g, body slip, kinematic yaw, yaw balance |
Your selection persists in the browser and is added to the URL when it differs from the default nine-panel stack. Laps recorded before a channel existed simply skip that line.
Understeer and oversteer, measured
Body slip is the angle between where the car points and where it is going, in degrees: positive with the nose to the right of travel, so into a right-hander and out of a left-hander. It is off by default, and zero below 29 km/h. The corner report card turns the sign per corner, so that rotation reads the same way in both directions.
Kinematic yaw is the rotation the front wheels asked for — speed × front
wheel angle ÷ wheelbase, the yaw rate with no tyre slip at all — and Yaw
balance is the measured yaw rate minus it: below zero the car turned less than
its wheels asked (understeer), above zero more (oversteer). Both need packet C
and are worked out from the full 60 Hz recording, not the chart's resampling.
Laid beside Steering, Front wheel angle shows the steering lock: where
the input keeps rising and the wheels go flat.
Aid intervention, measured rather than inferred
Throttle applied / Brake applied are the pedal after the aids acted on it.
Plotted against the raw pedal the two lines separate exactly where TCS or ABS
intervened; TCS cut and ABS release are that separation on its own. These
need the ~ packet format or wider — see
Configuration. Brake applied is filled in
live driving only: a replay does not carry it.
Engine torque
The torque the engine was delivering, in GT7's own normalized units, from a field
of the ~ packet the community decoded in 2026 (it is not documented by
Polyphony). It tracks the throttle and boost, goes negative on the overrun and is
exactly 0 with the clutch in or in neutral. It is not bounded to ±1: an electric
car's runs well past it.
Sector times
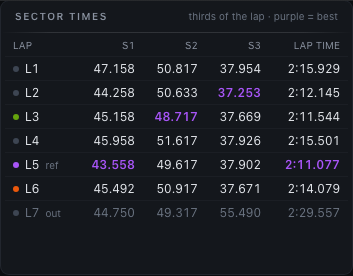
Every lap of the session, split at the circuit's sectors, one row per lap in lap order. The best of each sector and the best lap time are purple, counting only laps that count toward bests; a pit out-lap is listed faint and holds no best. Sector times are read off each lap's own clock where it passed the boundary, and the last sector takes whatever is left of the lap time, so the splits add up to the figure GT7 showed.
The boundaries are the track's own when they have been placed — on the Tracks page, beside the corners: each one is where a sector ends, and the last sector runs to the start/finish line. A circuit without them is split into thirds of the lap, which is what S1/S2/S3 always meant here; the panel's note says which. Either way the boundaries are places on the road: on a circuit without its own, the thirds are taken from the session's quickest lap and then found on every other lap, so that a wider line through a corner does not move the split. A lap that never passed a boundary (a cut, or another layout under the same name) shows no sector times.
Race line map
A top-down plot of the reference lap's driven line, coloured by the lens picked in the panel header:
- Inputs (the default): green = throttle, red = braking, blue = coasting.
- Speed: five bands from the lap's slowest to its fastest, red through amber to green, with the band edges in the key.
- Gain / loss: where the report card's lap is gaining time on the reference (green) and where it is losing it (red), read off the slope of the time diff over a 30 m window; grey where it is holding even. Needs a comparison lap.
- Tire temp: the hottest of the four tires at each point, on the scale of the Live view's tire tiles and Corner Detail: blue below 55 °C (cold), green 55–95 °C (working), red at 95 °C and above (hot).
- F−R temp: the fronts' average tire temperature minus the rears', the tire temp F−R balance channel drawn on the line. Red where the fronts run hotter, blue where the rears do, grey where the two are within 3 °C of each other — exactly 3 °C included, as Corner Detail's balance readout counts it. The colour is full from 8 °C, the gap at which the race engineer calls out one axle running hotter; the engineer measures that over a whole lap, the map shows where on the lap it happens.
A lens the comparison cannot draw — Speed on a recording without the channel, Gain / loss with only the reference selected, the tire lenses on a lap recorded before per-corner channels existed — is greyed out in the control, with a tooltip saying why, and the line is coloured by Inputs instead.
The lens is remembered on this device, and goes into the link when it is not Inputs. Opening a link that names a lens switches to it and remembers it, as a link's channels do. A lens the comparison cannot draw stays chosen — still in the URL, drawn as Inputs meanwhile — and takes over once the comparison can draw it.
The lap strip under the map is coloured the same way — the line unrolled. Other selected laps overlay as thin lines in their chart colours. The map follows the chart cursor, placing one dot per lap at the hovered distance so you can see the spatial gap between lines; hovering the line on the map moves the cursor everywhere else too. Point right at the line and a readout lists every lap the map shows there — the time diff and each chart panel, laid out like the chart tooltip — in the full-screen map too, where the charts are out of sight. Hover readout in Layers switches it off.
A metre across is a metre down, so a corner's shape on screen is its shape on the track. The axis ranges follow the plotting area's pixel aspect to keep it that way in any window; letting each axis fill the box independently stretches the map by whatever the circuit's aspect ratio happens to be — 8 % at Lago Maggiore Centre, nearly 3× at Deep Forest.
Position or time sync
sync: Time | Position in the map header (shown once more than one lap is on the map) chooses where the other laps' dots go:
- Time (the default) leaves the reference dot at the cursor and moves every other dot to where that lap had got to after the same elapsed lap time. A slower lap's dot trails the reference, a quicker one runs ahead, and the distance between them is the gap — which is what makes a gap legible while a lap plays back. Hovering a chart, the dots show where the other cars were when the reference reached that point. A dot that has finished its lap waits at its last recorded point, a few metres short of the line.
- Position puts every dot level with the reference car — at the same point of the track, as the charts and Corner Detail compare them. The dots then differ only by the line each lap took there, which is worth seeing zoomed into a corner and very little at circuit scale.
The choice is remembered on this device, like Follow. Only the map changes; the charts, the traction circle and Corner Detail stay on distance.
Both are exact about where a car was. Every compared lap is lined up with the reference by place, not by how far it had gone — the two differ by metres a lap, because a wider line is a longer lap — so in Position mode "level" really means level, to within centimetres. Time mode draws each car from its own recorded positions against its own clock, likewise within centimetres; where GT7 reset a car onto the track, its dot jumps to the new spot instead of sliding across the infield. Lap 1 of a race starts from the grid rather than the line; it doesn't count as a lap time (see Sessions), and time sync can't line it up with a lap that started at the line.
Dots and the Follow camera are placed at the exact cursor position, between the recorded 5 m steps, so the camera pans smoothly during playback. Follow tracks the playhead only: hovering a chart moves the dots but leaves the map framed as it was.
Zooming the map
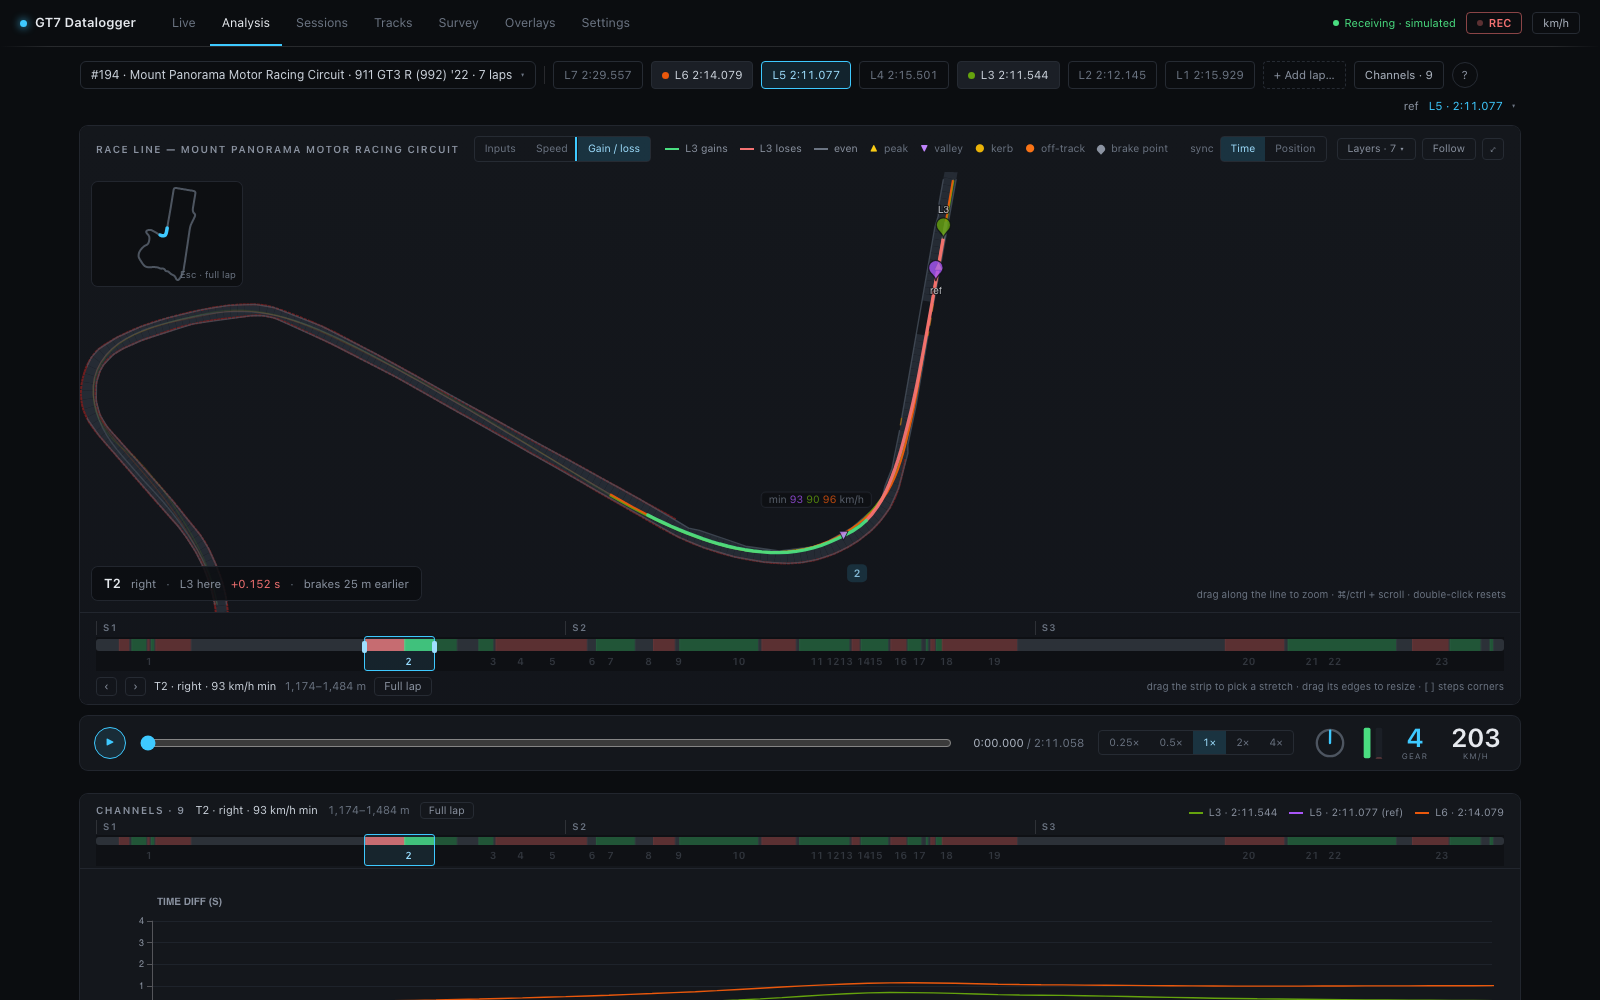
Everything shares one zoom window, so the map, the strip, the charts and the deviation chart always show the same stretch. On the map itself:
- Click a corner number to zoom to that corner, from where the reference began
braking for it (30 m before, or before the turn-in on a corner it did not brake for) to
40 m past the exit.
[and]step through the corners and wrap. - Drag along the line to zoom to that stretch, padded 15 m either side. A translucent band shows the pick while you drag.
- ⌘/Ctrl + wheel zooms about the pointer, ×0.8 or ×1.25 a notch and never narrower than 80 m. A plain wheel still scrolls the page.
- Double-click, Esc or Full lap come back out. Esc closes an open menu first.
Zoomed in, the stretch is drawn thicker over the whole lap in faint grey, a locator inset in the top left shows where on the lap it is (click it to come back out), each corner in view carries an apex badge with the minimum speed of every lap through it in lap colours, and when the window is a corner a callout in the bottom left says what the report card's lap did there against the reference — the time lost or gained and where it braked. The window animates into place.
Layers
Everything besides the reference line is a layer with a switch in the Layers menu, listed only when the selected laps have something to put on it; the choices are remembered on this device. Track: the surveyed road, the corner numbers. Laps: the other laps (switching them off hides their markers and cursor dots too), their apex speeds, their brake points, the hover readout (every lap's values where you point at the line). Markers: ▲ speed peaks and ▼ valleys, kerb and off-track contact, chassis events, TCS and ASM rings. Events and the aid rings start off; everything else starts on.
- Events marks where each detected chassis event began: ◆ lockup, ● wheelspin, ✚ bottoming, ✖ kerb strike. Markers are filled with the lap's color, so with several laps selected the pattern is the reading — three diamonds in one braking zone is a lockup that happens there every lap. Hover a marker for the lap, the wheels and how bad it was; click it to zoom every panel to the event with 60 m of track either side. Suspension events are detected per wheel, so same-type events that begin within 6 m of each other are drawn as one marker naming all the wheels.
- TCS draws a hollow ring, in the lap's color, on every sample where traction control was cutting power. Traction control catching the car at the same exit every lap says the car is over the limit there; rings that disappear from one lap to the next without the lap getting slower say TCS can come down a step. ASM does the same for stability management with hollow squares, and starts switched off.
Every layer follows the zoom, and the key in the panel header lists only what is drawn in the current window. Laps recorded before per-corner channels existed have no events and no aid rings.
Brake points
A pin marks where each lap began braking for one corner, in the lap's colour: the reference's, and the lap the corner report card is about. The corner is the row under the pointer in the card — or, with the pointer elsewhere, the corner the view is zoomed to, so that clicking a row and scrolling up to the map finds the pins still there. Hover a pin for how many metres earlier or later than the reference it is. A lap that took the corner without braking has no pin. The map's frame widens to take in the pins of the corner it is showing: a braking zone begins well before the corner itself.
Lap strip
The bar under the map is the whole lap unrolled, coloured by the active lens, with the track's sectors as S1…Sn buttons above it and the corner numbers under it at their apex. The zoom window is drawn on it and driven from it:
- Drag on empty bar to pick a new stretch.
- Drag an edge of the window to resize it (never narrower than 40 m).
- Drag inside the window to slide it along the lap.
- Click (without dragging) to zoom to the corner under the pointer; click a sector button to zoom to that sector.
The row beneath it names the window — T5 · left · 94 km/h min, Custom stretch or
Full lap — with its range in metres, ‹ › to step through the corners, and Full
lap when zoomed. A compact copy of the strip is pinned at the top of the charts panel
and takes the same gestures, with the channel count, the window and the lap key beside it,
so with every channel on the zoom stays in reach while the charts scroll.
The sectors are the circuit's own when it has boundaries placed, otherwise thirds of the lap; see Sector times. The corners come from the reference lap's curvature, or from the circuit's authored corners when it has them — in which case the numbering is the same in every session, not just within this one.
Corners
Corner numbers sit just outside each apex on the map, the current one lit in the accent
colour, and under the strip; clicking either zooms to that corner — see
Zooming the map. In the full-screen view a corner strip under the map
lists them as chips with ‹ › and lap for the whole circuit, and names the selected
one (T5 · left · 94 km/h · 63°).
Full screen
⤢ (top right of the map) opens the same map as large as the window will allow, which is the difference between a squiggle and a track on anything longer than a kart circuit. The maximized view adds scroll to zoom and drag to pan — off in the rail, where a wheel that sometimes scrolls the page and sometimes zooms a chart is worse than one that always scrolls — plus the selected corner's minimum speed and total angle. Escape or Close returns.
Under the line: the surveyed road. If the session's circuit has been named and
surveyed, the map draws the track itself beneath every lap — road surface,
both borders, hand-marked walls in dark red, and the start/finish line. A racing line
only means something against the road it was driven on: whether the apex was clipped,
how much kerb was used, whether there was tarmac left on the exit. Circuits with no
bundle simply draw as before. The geometry is compiled server-side
(/api/track-outline) — a bundle holds up to 50,000 border records and the browser
never sees them.
The road is drawn only where it was actually surveyed. Stretches the survey never covered appear as dashed amber "unsurveyed gap" markers rather than invented road — the map's own go touch this prompt: drive that stretch on a survey run and the hole fills in.
Split view
Split (top right of the map, on a screen wide enough for two columns) puts four charts beside the map instead of below it — as many as stand as tall as the map — so the line and the inputs that drew it are in view together. Each of the four is picked in the panel's own header, from every channel, and they share the cursor and the zoom with the map and the full chart stack, which stays below unchanged. Speed, throttle, brake and gear to begin with; the choice and the switch are remembered on this device, like Follow. On a narrower screen the map keeps the full width.
Traction circle (g-g)
Every moment of the lap plotted as lateral g against longitudinal g, coloured by input zone: braking at the bottom, power at the top, corners out to the sides, and the combined phases — trail-braking in, picking up throttle while still turning — filling the diagonals. How much of the ring gets used is the reading; an empty middle-left and middle-right is a car that never brakes and turns at the same time. Other selected laps appear as faint dots in their own colours, and the four numbers underneath are the peak g reached in each direction.
The panel appears whenever the recording has the accelerometer (packet B or wider).
GT7 documents no unit for these channels
So the app checks them rather than trusting them: the server fits each axis against
physics the same lap recorded — lateral against v × ω from the driven path,
longitudinal against dv/dt — which recovers both the unit and the sign. The
footnote under the diagram reports the fit. When a lap gave too little steady
cornering or braking to check, it says scale unverified and assumes m/s²: the
shapes still compare between laps, the absolute numbers may be off by a constant.
Corner Detail widget
A top-down car with four corner cells that replays the load-transfer story as you scrub the charts:
- cell color = that wheel's tire temp (blue < 55 °C, green 55–95 °C, red ≥ 95 °C)
- bars = suspension compression, normalized to that lap's travel range
- LOCK / SPIN badges using the live thresholds (brake ≥ 20 % & slip < 0.9; throttle ≥ 40 % & slip > 1.1)
- F/R temp balance readout at the bottom
One lap is in focus at a time; the reference lap is always the ghost — small secondary temps and dashed suspension levels — and a cell gets a red/blue ring when the focus lap runs more than 3 °C hotter/cooler than the reference at that point. With 3+ compared laps, focus chips let you switch the focus lap.
Gearing
One lap's gearbox, as a table and as the classic sawtooth chart under it.
- The table gives each gear's ratio and the speed it reaches at the redline, then the redline itself, and GT7's top speed for the setup on laps that store one.
- The lines, one per gear, run from standstill to the redline (dashed), each labelled with its gear where it meets it. That meeting point is the table's speed at redline, so the table and the chart always agree.
- The dots are the lap itself: speed across, rpm up, a dot every 5 m, coloured like its gear's line. They climb a gear's line to where the driver shifted and drop to the next. How close each tooth tops out to the redline is the shift point; how far the rpm falls across a shift is the gap between those two ratios; and a top gear whose line runs far beyond the last dots is a gearbox longer than the circuit needs. Points caught mid-shift, in neutral or in reverse are left out; a long lap is thinned to 1,500 dots, always keeping the two either side of every shift. The white dot is the car at the cursor, ringed in the colour of the gear it was in, and follows hover and playback like every other panel.
The lap is the corner report card's focus lap, the same one the Gain / loss lens compares, or the reference when no other lap is loaded; the panel's title names it. When the reference runs a different gearbox (a guest lap in another car, or the same car on another setup), its dots and lines are drawn behind in grey, the lines dashed. On the same gearbox they would only repeat the focus lap's lines, so they are left out.
GT7 sends the ratios and the redline but never the final drive, and a lap keeps no tire size; those two decide how fast a gear goes at a given rpm. So the lines are fitted to the lap: the speed per rpm is read off the stretches where the driven wheels turned with the road, and checked to agree across the gears (the math). When the lap gives no consistent fit (too few steady samples, or one gear all the way round an oval), GT7's top speed for the setup stands in as top gear's speed at the redline. The line under the chart says which.
Laps recorded before 0.7.0
These hold a ratio where GT7's top speed now goes, so the table leaves the top speed out and there is nothing to fall back on: a lap the fit refuses shows its dots with no lines, and "—" for every speed at redline. A lap that fits gets the full chart, whenever it was recorded. The simulator's rpm does not follow its ratios, so a simulated lap is never fitted; its lines come from the simulator's top speed, and its dots do not sit on them.
Side panels
- Race engineer — post-lap notes — the race engineer's coaching findings as text, in the exact wording voice would have used: "repeated front-left lockups into turn four", "you are braking early into turn six, about fifteen meters", "you lost three tenths in turn five — braked eighteen meters earlier and carried five kilometers per hour less at the apex". Grouped per lap, newest first, with the currently compared laps highlighted; a note that names a corner zooms the charts and map to it on click. The notes are replayed from the stored session through the same detector the voice engineer uses — same thresholds, same reference (the session best as it stood at the time), same repetition windows — so they exist for every recorded session, whether or not voice was ever enabled.
- Gearing — the focus lap's ratios and the sawtooth chart; see Gearing.
- Consistency — best 5 laps — median speed plus a deviation band across the session's best laps; a wide band marks corners you drive differently every lap.
- Lap times — this session — every lap as a point, lap number across and lap time up, with a line through the laps that count, the median dashed and a band one standard deviation either side of it. Under the chart: the spread (the standard deviation of the counting laps' times, and that as a percentage of the median so circuits of different lengths compare), the median and the best. The spread is taken over the laps that count toward bests and no others — a pit out-lap, a race's lap 1 from the grid and laps excluded by hand are drawn hollow and left out, and a lap too slow for the scale is pinned to the top edge as a hollow △ so one out-lap can't flatten the rest. It needs three counting laps. Laps in the current comparison take their chart color; click any point to add that lap to the comparison or take it out.
- Fuel strategy — the relative fuel-map table: for each setting −5…+5 vs the reference lap's, projected fuel/lap, laps remaining, time remaining, and lap-time cost.
- Tuning info (reference lap) — max speed, min ride height, input percentages, tire spin, fuel used, car category, aid usage (TCS/ASM %), engine health (max water/oil temp, min oil pressure), Corners a gear high — of the corners GT7 suggested a gear for, how many the reference lap took in a higher one ("2 of 9"; see Gear choice, and left out when GT7 suggested nothing) — and the detected-event summary. When the circuit is named and the car's class is known, it also shows the class benchmark — the fastest full lap ever recorded at this circuit in the same category (laps excluded by hand never set it, and a reference lap that doesn't count is not measured against it), the gap to the reference lap, a link to open it, and compare, which pulls the benchmark lap straight into the current comparison as a guest chip — the question the benchmark raises ("where does it gain?") answered in the same view that raised it. Scoped by class on purpose: a Gr.3 time and an N100 time around the same corners are not the same achievement. Sessions excluded from bests never provide the benchmark — a replay of the leaderboard leader is not your class best.